
Ageing Population Statistics Ireland 2026: 891,100 People Were Aged 65 or Over

Sources reviewed 27 October 2026 · Estimated reading time: 11 minutes. Human written and fact checked against each named source.
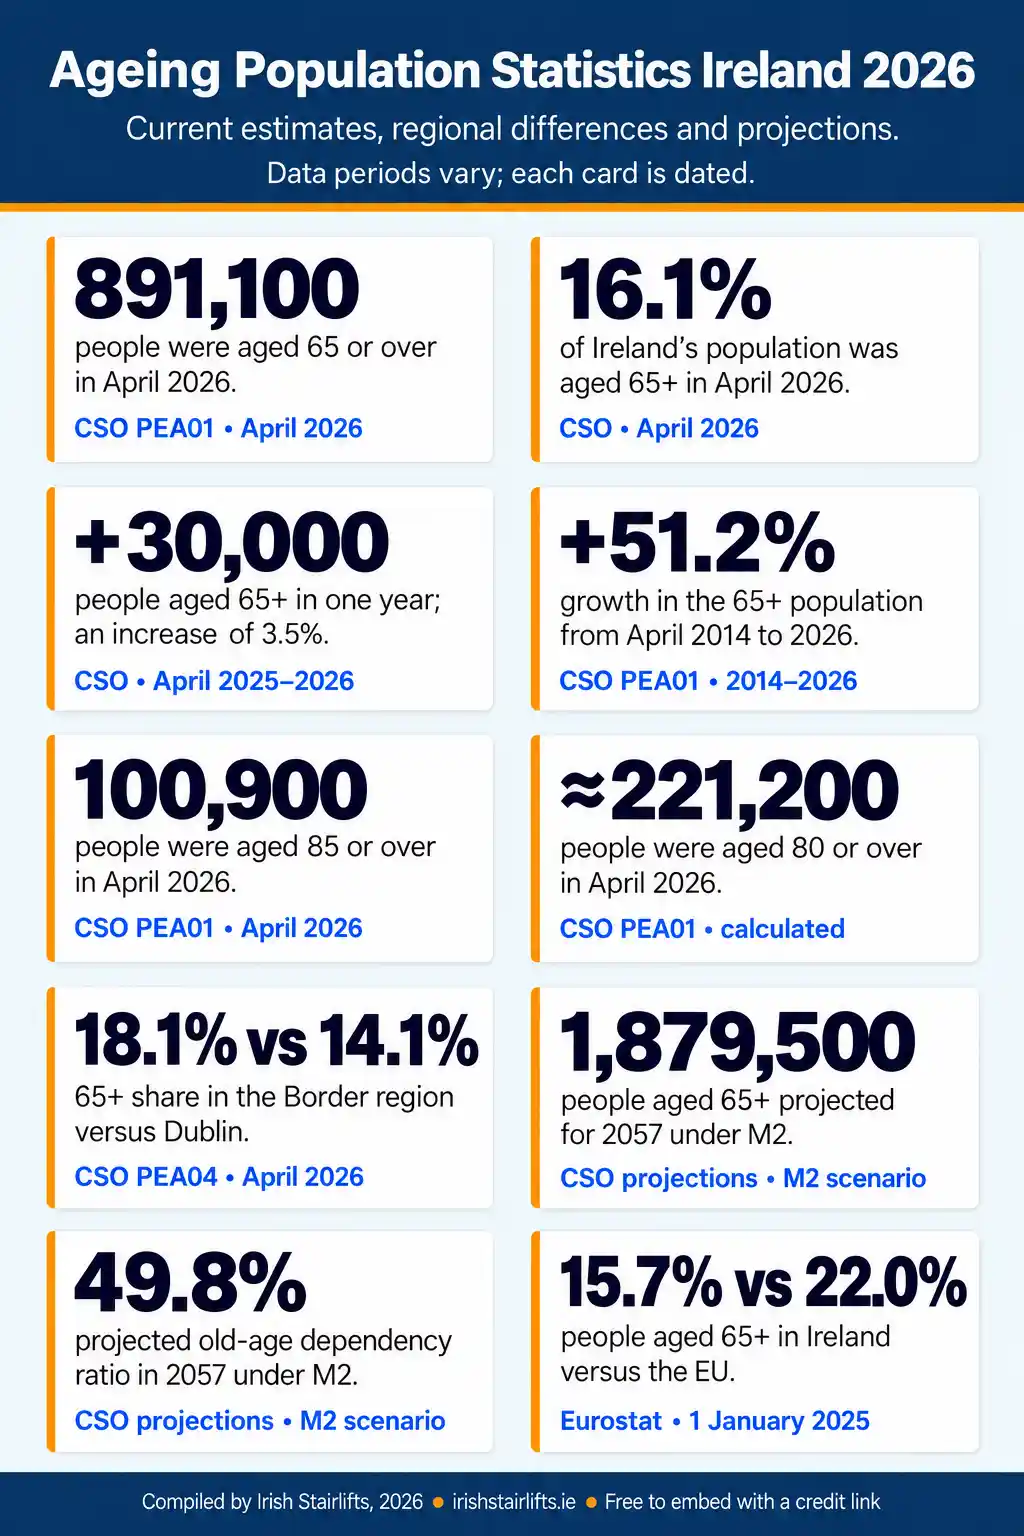
Ireland’s population is growing older as the number and share of people in later life increase. The newest Central Statistics Office estimate puts the population aged 65 years and over at 891,100 in April 2026, while official projections show that this group could approach 1.9 million by 2057 under the CSO’s moderate migration scenario.
This roundup separates current estimates from historical figures and future projections. The 2026 in the title is the edition year. The latest national population figures estimate April 2026, the CSO projection series starts from a 2022 base, and the Eurostat comparison uses a matched reference date of 1 January 2025.
Key ageing population statistics at a glance
- Ireland had an estimated 891,100 people aged 65 years and over in April 2026, representing 16.1% of the population, according to the CSO April estimates.
- The 65+ population increased by 30,000 people, or 3.5%, between April 2025 and April 2026, the same CSO release shows.
- Since April 2020, the estimated 65+ population has increased by 165,000 people, or 22.7%, according to the population estimates.
- Ireland had an estimated 100,900 people aged 85 years and over in April 2026, the PEA01 table records.
- Approximately 221,200 people were aged 80 or over in April 2026, calculated by adding the CSO’s 80–84 and 85+ age bands in the PEA01 data.
- The estimated 65+ population grew by 301,600 people, or 51.2%, between April 2014 and April 2026, calculated from the same CSO series.
- Among the eight regions, the calculated 65+ share ranged from 14.1% in Dublin to 18.1% in the Border region in April 2026, based on the regional table.
- Under the CSO’s M2 scenario, the 65+ population is projected to reach 1,226,300 in 2037 and 1,879,500 in 2057, the projection tables show.
- Under that scenario, the population aged 85+ is projected to rise from 84,400 in 2022 to 389,400 in 2057, according to CSO Table 2.6.
- On 1 January 2025, people aged 65+ represented 15.7% of Ireland’s population and 22.0% of the EU population, using the same Eurostat age data.
Ageing Population Statistics Ireland 2026 Infographic
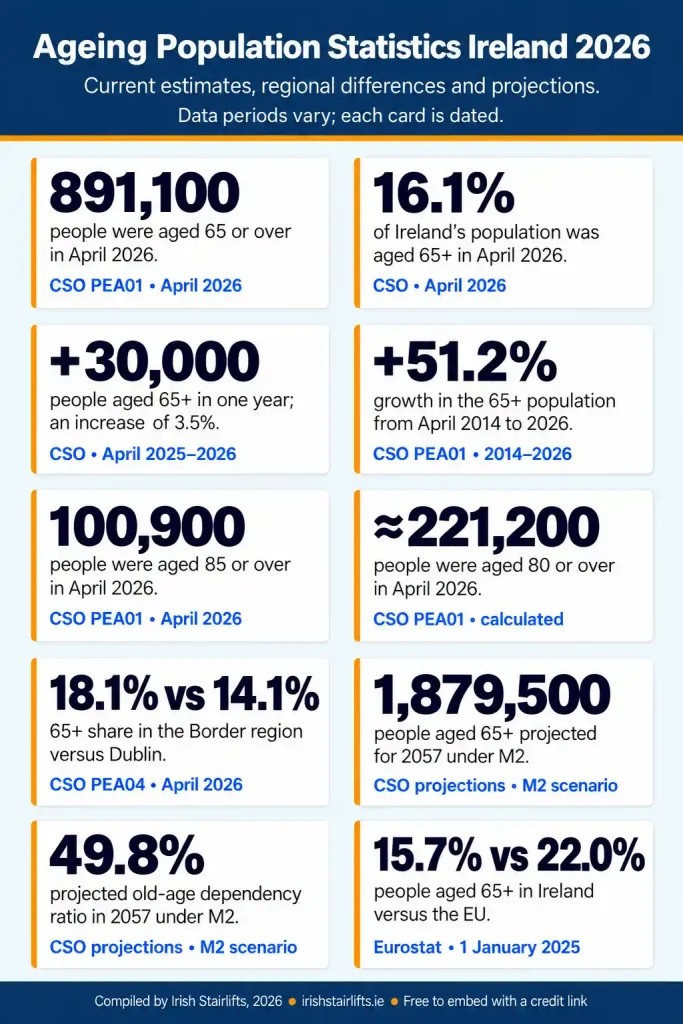
Ageing Population Statistics Ireland 2026, compiled by Irish Stairlifts. Free to embed. Please credit Irish Stairlifts with a link to this page: https://irishstairlifts.ie/ageing-population-statistics-ireland/
How Ireland’s older population is growing
The CSO estimated Ireland’s usually resident population at 5,525,600 in April 2026. Of that total, 891,100 people were aged 65 or over, giving a published population share of 16.1% in the April 2026 release.
The change is visible over both short and longer periods. The 65+ total increased from 861,100 in April 2025 to 891,100 in April 2026. That was an increase of 30,000 people, or 3.5%, in one year. Compared with April 2020, when the same series recorded 726,100 people aged 65+, the 2026 estimate was 165,000 higher, an increase of 22.7%.
Looking back to April 2014 gives a longer consistent comparison. The CSO population table recorded 589,500 people aged 65+ that year. By April 2026, the group was 301,600 larger. That represents calculated growth of 51.2% across the 12-year period.
The population share has also shifted. In 2016, the CSO series recorded 629,800 people aged 65+ within a population of 4,739,600. This equated to 13.3%. In 2026, the comparable share was 16.1%, an increase of 2.8 percentage points. Percentage points are used here because the comparison concerns two shares of the population, rather than the relative percentage growth of the older group.
These figures describe demographic change. They do not show how many older people are retired, disabled, living alone, receiving care or considering an adaptation to their home. Those questions require their own definitions and sources.
The CSO marks its 2023 to 2026 population estimates as preliminary. It may revise the intercensal series after a later Census supplies a new benchmark. The estimate also uses a usually resident population concept, while the Census count uses its own published population basis. For that reason, figures from an annual estimate and a Census table should retain their source labels and should not be presented as though they were interchangeable observations from the same series.
How many people are in each older age group
The 65+ population includes several generations, and a single total can hide substantial differences between people in their late sixties and those in their eighties or nineties.
In April 2026, the CSO age table estimated that 265,100 people were aged 65–69 and 223,900 were aged 70–74. A further 180,800 people were aged 75–79, while 120,300 were aged 80–84 and 100,900 were aged 85 or over.
Adding the two oldest published bands gives approximately 221,200 people aged 80 or over. This is a calculation from two compatible values rounded to the nearest 100 people, so it should be described as approximate rather than as an unrounded administrative count.
Age bands are useful for planning, but they cannot identify a person’s health, independence or home-access needs. Many people remain active and independent well beyond 65, while some younger people require mobility support or accessible housing. The site’s separate mobility disability statistics explain why an age total should not be used as a substitute for a functional measure.
Men and women in the older population
The CSO estimated 420,400 men and 470,700 women aged 65+ in April 2026. Together, the two figures match the national total of 891,100 in the PEA01 dataset.
The difference was wider in the oldest age band. Among people aged 85 or over, the table recorded an estimated 40,000 men and 60,900 women. Women therefore accounted for about 60.4% of this age group, calculated from the rounded CSO values.
These counts are demographic descriptions rather than explanations. The table does not show why the populations differ, and the figures should not be used to infer individual longevity, health status or support needs.
Where Ireland’s older population lives
The April 2026 regional table does not publish a ready-made 65+ total. To create a consistent regional comparison, this roundup adds the five age bands from 65–69 through 85+ and divides that sum by each region’s all-age population in the CSO regional data.
The Border region had the largest calculated 65+ share at 18.1%, with approximately 81,100 older residents among a total population of 447,600. The Mid-West followed at 17.8%, while the West was 17.6%, the South-East 17.5% and the South-West 17.3%.
The Midland region’s calculated share was 15.8%, and the Mid-East’s was 15.1%. Dublin had the smallest share at 14.1%, but it had the largest raw number of residents aged 65+, approximately 225,600, because its total population was much larger.
That distinction matters. A region can have a lower older-person share while still having more older residents in absolute terms. Neither the count nor the share measures access to services, the prevalence of disability or the number of suitable homes. The inputs are also rounded to the nearest 100 people, so regional totals and shares are approximate.
For housing context rather than population composition, the separate older people’s housing statistics examine tenure, household type and housing conditions using Census and survey evidence.
What official projections show to 2057
The CSO’s 2023–2057 projections begin from a Census 2022-based usually resident population estimate. They are scenarios based on stated assumptions, not forecasts of what will definitely happen.
The three variants use the same fertility and mortality assumptions but different migration paths. The high-migration M1 scenario tapers to annual net migration of 45,000 by 2027. The moderate M2 scenario tapers to 30,000 by 2032, while the lower-migration M3 scenario tapers to 10,000 by 2032.
Under M2, the population aged 65+ is projected to increase from a 2022 base of 781,400 to 915,800 in 2027. It reaches 1,226,300 in 2037 and 1,879,500 in 2057. At the end of the period, that would represent 29.2% of the projected M2 population of 6,446,300.
The 2057 total varies across the scenarios. M3 produces 1,809,500 people aged 65+, while M1 produces 1,944,400. However, the older-person share is higher under M3 at 31.6%, compared with 27.8% under M1, because the projected total population is smaller under the lower-migration scenario.
The oldest group changes particularly sharply in the M2 tables. The population aged 85+ rises from 84,400 in 2022 to 181,600 in 2037 and 389,400 in 2057. The endpoints amount to a calculated increase of 305,000 people. This projection should not be converted into a future count of people who will need home support, residential care or mobility equipment.
Separate roundups examine the evidence for HSE home support and nursing home capacity. Those pages use service and capacity measures rather than assuming that everyone in an age group has the same needs.
What the dependency ratios mean
The old-age dependency ratio compares the number of people aged 65+ with the population aged 15–64. In the CSO projection base, the ratio was 23.1% in 2022. Under M2, it is projected to reach 31.5% in 2037 and 49.8% in 2057, according to CSO Table 2.4.
This is a conventional measure of age structure. It does not mean that every person aged 65+ is financially dependent, nor that every person aged 15–64 is employed. Some people continue working beyond 65, while some people within the working-age band are outside employment.
The total age-dependency ratio combines children aged 0–14 and people aged 65+, then compares that combined group with people aged 15–64. Under M2, it rises from 53.0% in 2022 to 70.8% in 2057. It is useful for describing changing population structure, but it is not a direct measure of tax contributions, care provision or household dependency.
Ireland compared with the EU
Eurostat provides a matched comparison using the same definitions and reference date for Ireland and the EU27. On 1 January 2025, people aged 65+ represented 15.7% of Ireland’s population, compared with 22.0% across the EU, according to the Eurostat age structure.
Ireland also had a younger median age in that dataset. The median was 39.6 years in Ireland and 44.9 years across the EU. Median age divides the population into two equal-sized groups and should not be confused with average age or life expectancy.
The same Eurostat table gives Ireland an old-age dependency ratio of 23.8%, compared with 34.5% across the EU. People aged 80+ represented 3.8% of Ireland’s population and 6.2% of the EU population. The total age-dependency ratios were 51.9% and 57.1% respectively.
These are aligned comparisons for 1 January 2025. They should not be mixed with the CSO’s April 2026 estimate as though both measured the same date. Ireland’s lower older-person shares also do not establish differences in health, accessibility or service quality. Population structure is one factor among many.
How we compiled these statistics
Irish Stairlifts reviewed the primary sources on 27 October 2026. Current national counts, age bands, sex breakdowns and historical comparisons come from the CSO’s Population and Migration Estimates and its PEA01 table. Regional calculations use the compatible PEA04 age bands and all-age totals.
Future figures come from the CSO’s Population and Labour Force Projections 2023–2057. We keep M1, M2 and M3 labels attached to the results and describe them as scenarios. The article uses M2 for a consistent central narrative while retaining the M1-to-M3 range where it materially changes the interpretation.
The EU comparison comes from Eurostat’s demo_pjanind dataset for 1 January 2025. Ireland and EU27 use the same age thresholds, indicators and reference date. Eurostat recommends a usually resident population definition but notes that national submissions can use registered or legal population concepts.
Counts in the CSO estimate and projection tables are published in thousands to one decimal place. Calculated percentages are rounded to one decimal place. The regional 65+ total is built from five rounded age bands, which is why the eight regional values sum to 891,200 rather than the dedicated national total of 891,100. The national headline therefore uses PEA01.
How Irish Stairlifts can help
Population statistics cannot show whether a stairlift or another adaptation is suitable for a particular person or property. A recommendation should consider the individual’s needs, the staircase, the home layout and any relevant professional advice.
Irish Stairlifts supplies straight, curved and reconditioned stairlifts across Ireland. The stairlift service page explains the available options and how to arrange a home assessment.
Readers researching the wider home context can also use the site’s accessibility needs statistics and adaptation grant statistics. Grant decisions remain with the relevant local authority, and work should not begin until any required written approval has been received.
Related Post
categories
- Accessible Bathrooms 22
- Grants & Funding 8
- ISB Mobility 6
- Mobility Aids 42
- Outdoor & Independence Solutions 44
- Seating Solutions 10
- Stairlifts & Home Lifts 37
- Statistics 12