
Delayed Hospital Discharge Statistics Ireland 2026: 103,786 Bed Days Lost Through July

Sources reviewed 10 November 2026 · Estimated reading time: 12 minutes. Human written and fact checked against each named source.
Delayed hospital discharges affect patients who have finished the acute stage of their care but cannot yet move safely to their next setting. They also keep acute beds occupied when those beds could otherwise be used for people who need hospital treatment.
This roundup was prepared in 2026, but its figures cover several different periods. The newest operational evidence is the week ending 1 November 2026, the newest detailed monthly evidence is the July 2026 report, the latest completed-year HSE total covers calendar 2025, and the available cross-country comparison uses older 2016 data.
Key delayed discharge statistics at a glance
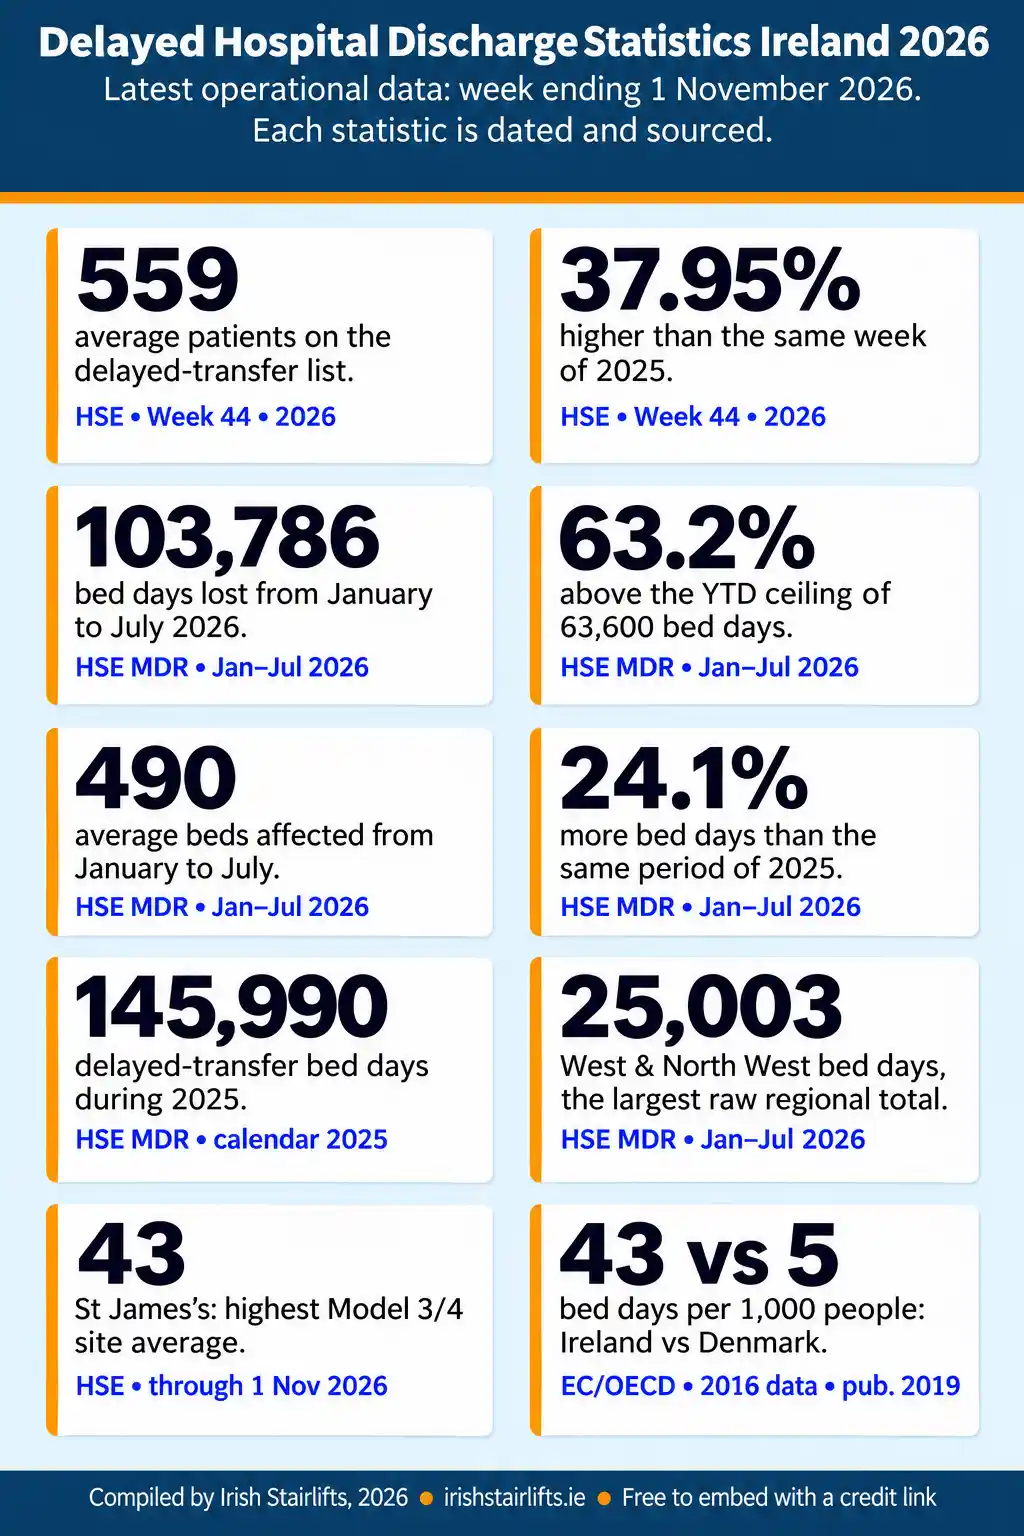
- An average of 559 patients were on Ireland’s delayed-transfer-of-care list during the week ending 1 November 2026, the HSE weekly report shows.
- That weekly average was 37.95% higher than in the same week of 2025 and 51.18% higher than in the same week of 2024, based on the same HSE report.
- Irish acute hospitals recorded 103,786 bed days lost to delayed transfers from January through July 2026, according to the July management report.
- The January to July bed-day total was 63.2% above the HSE’s year-to-date ceiling of 63,600 bed days, the HSE performance table records.
- The average number of beds subject to delayed transfers was 490 from January through July 2026, also 63.2% above the year-to-date target, according to the July HSE figures.
- Delayed-transfer bed days were 24.1% higher in the first seven months of 2026 than during the same period of 2025, the HSE comparison shows.
- Ireland recorded 145,990 delayed-transfer bed days during calendar 2025, with an average of 409 beds affected, according to the HSE annual outturn.
- West and North West recorded 25,003 bed days lost from January through July 2026, the largest raw regional total in the six-region HSE table.
- St James’s Hospital had the highest Model 3 and Model 4 site average shown for 2026 to 1 November, at 43 patients, in the Week 44 report.
- A historical European comparison recorded 43 delayed-discharge bed days per 1,000 people in Ireland in 2016, compared with 5 in Denmark and 40 in Sweden, in the 2019 country profile.
Delayed Hospital Discharge Statistics Ireland 2026 Infographic
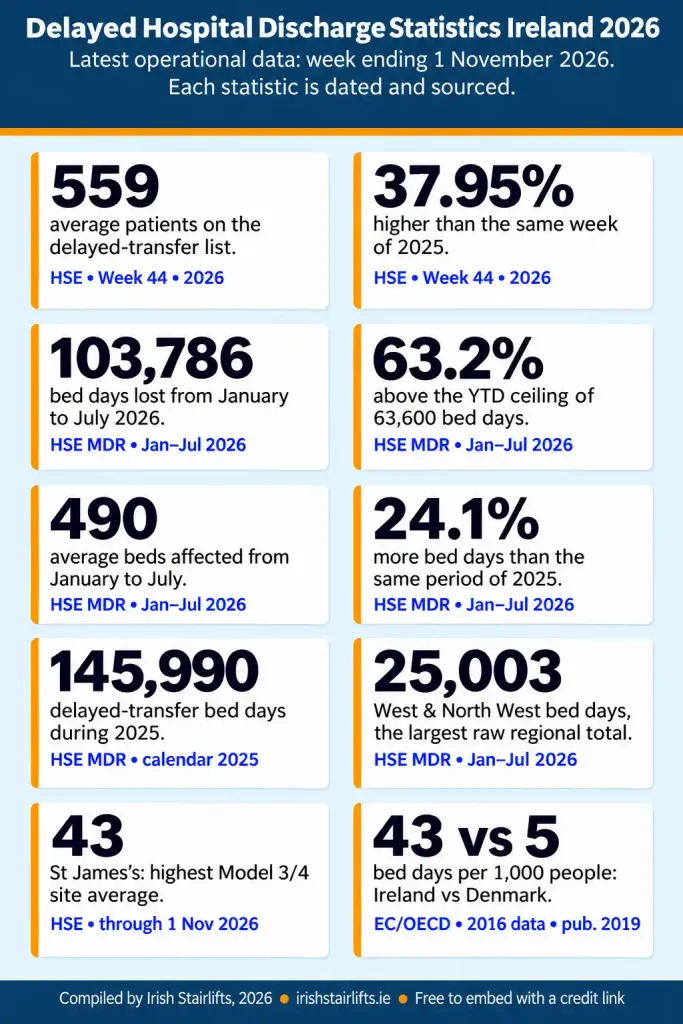
Delayed Hospital Discharge Statistics Ireland 2026, compiled by Irish Stairlifts. Free to embed. Please credit Irish Stairlifts with a link to this page: https://irishstairlifts.ie/delayed-discharge-statistics-ireland/
Definition of a delayed transfer of care
The HSE defines a delayed transfer of care as a situation in which a patient is ready to leave hospital but continues to occupy a bed. The delay may occur because the patient is waiting to go home with support or needs to move to another care setting that is not yet available.
This is different from waiting in an emergency department for admission. It is also different from a hospital waiting list for a planned operation or outpatient appointment. The delayed-transfer measure concerns people who have already received acute inpatient care and are medically ready for the next stage.
The distinction matters because the HSE publishes several measures that may look similar. A nightly or weekly count shows how many patients are delayed at a point in time or on average during a short period. Bed days lost measure the cumulative number of days for which acute beds remained occupied. Neither measure is the number of people who experienced any delay during an entire year.
The latest national picture in 2026
An average of 559 patients were on the delayed-transfer list during the week ending 1 November 2026, according to the HSE Week 44 report. The report uses a seven-day average rather than a single midnight snapshot.
The Week 44 average was 1.48% higher than the previous week’s average, the weekly comparison shows. A one-week movement should not be treated as a long-term trend, but the year-on-year comparisons were also higher. The same figure was 37.95% above the comparable week of 2025 and 51.18% above the comparable week of 2024.
The HSE separately presents a year-to-date chart for Model 3 and Model 4 hospitals. Those sites had a combined average DTOC count of 456 through the week ending 1 November 2026, which was 25.81% higher than the comparable 2025 figure and 30.80% higher than the comparable 2024 figure, the site-level chart records.
That total does not include every hospital type, so it should not be substituted for the national all-site weekly average of 559. The HSE also notes that new daily average calculations have been applied, which limits casual comparisons with older reports that used a different presentation.
Bed days lost and the 2026 HSE targets
The most detailed current management table covers January through July 2026. It records 103,786 bed days lost to delayed transfers during those seven months, according to the July management report.
The year-to-date ceiling was 63,600 bed days, meaning the recorded total was 63.2% above target, the same HSE table states. For the full year, the HSE set a ceiling of 109,500 bed days and an average of no more than 300 beds subject to delayed transfers.
From January through July, the actual average was 490 beds, also 63.2% above the year-to-date target, the HSE performance data shows. This average describes the stock of beds affected over the period. It is not a count of 490 unique patients.
Monthly activity remained elevated across the latest three months in the report. May recorded 15,954 bed days lost and an average of 515 beds, June recorded 15,392 bed days and an average of 513 beds, and July recorded 15,961 bed days and an average of 515 beds, based on the monthly HSE series.
Change from 2025 to 2026
The same seven months of 2025 recorded 83,620 delayed-transfer bed days, compared with 103,786 in 2026, the HSE year-on-year table shows. The HSE reports the increase as 24.1%.
The average bed measure rose from 404 during the comparable 2025 period to 490 through July 2026. That was an increase of 21.2%, according to the published comparison.
For the latest completed year, Irish acute hospitals recorded 145,990 delayed-transfer bed days during 2025 and an annual average of 409 affected beds, the HSE annual outturn reports. A separate HSE parliamentary response gives an end-December 2025 snapshot of 407 patients, in the hospital-level table.
These figures are not contradictory. The 409 annual average and the 407-patient snapshot use different reporting clocks. The same parliamentary response reports 141,515 bed days lost during 2024 and 345 patients in the end-December 2024 national snapshot.
Regional differences in delayed transfers
The six HSE Health Regions recorded substantially different raw totals through July 2026. West and North West had 25,003 bed days lost and an average of 118 affected beds, while Dublin and South East recorded 24,068 bed days and an average of 114 beds, according to the regional HSE table.
Dublin and Midlands recorded 19,764 bed days and an average of 93 beds, while South West recorded 17,329 bed days and an average of 82 beds, the same regional table shows.
Dublin and North East recorded 10,103 bed days and an average of 48 beds. Mid West recorded 7,519 bed days and an average of 35 beds, based on the January to July figures.
These are raw service totals, not population-adjusted rates. A region may have more hospitals, more beds, a larger population or a different mix of services. The numbers therefore show where the recorded activity occurred, but they do not establish a regional league table for access or quality.
Hospitals with the highest year-to-date averages
Among the Model 3 and Model 4 sites shown in the Week 44 report, St James’s Hospital had the highest year-to-date average at 43 delayed-transfer patients. Galway University Hospitals followed at 39, Cork University Hospital at 37, St Vincent’s University Hospital at 34, Letterkenny University Hospital at 33 and Sligo University Hospital at 32, according to the HSE site chart.
Completed-year bed-day totals can show a different pattern because they accumulate every day of delay. Galway University Hospitals recorded 12,826 bed days in 2024 and 15,430 bed days in 2025, while its end-December snapshot moved from 35 to 37 patients, the HSE hospital table reports.
Letterkenny University Hospital recorded 8,942 bed days in 2024 and 12,214 bed days in 2025. Its end-December snapshot increased from 20 to 35 patients, based on the same HSE response.
The table does not explain why each hospital changed. Differences may reflect patient needs, service capacity, the availability of onward care and reporting conditions, so the figures should not be converted into claims about a hospital’s performance without further evidence.
Reasons recorded for delayed transfers
The HSE’s weekly reporting groups delays into several categories. These include long-term care, access to rehabilitation, complex clinical needs, legal complexity, home-support services, homelessness or housing support and adjustment, non-compliance or non-cooperation with the process, and COVID-19-related reasons, as listed in the weekly reporting guide.
The categories show why it would be inaccurate to describe every delayed transfer as a home-care problem. Some patients need a residential placement or rehabilitation bed. Others have complex clinical, legal or housing circumstances. A home adaptation may be relevant to an individual discharge plan, but it is only one potential factor within a much wider system.
Ireland in European context
There is no current harmonised Eurostat series that measures delayed transfers of care in the same way as the HSE’s 2026 reports. The closest exact cross-country comparison found is historical and must be treated as such.
Using 2016 data, the European Commission and OECD reported 43 delayed-discharge bed days per 1,000 people in Ireland. The same selected-country table reported 5 per 1,000 in Denmark, 16 in Norway, 40 in Sweden and 34 in England, according to the 2019 Irish profile.
The comparison covers only five countries and predates the current HSE series. Differences in definitions and health-system organisation may also affect the figures. It cannot support a current EU ranking for Ireland.
A newer system-capacity measure offers context rather than a direct comparison. In 2023, curative-care bed occupancy was 87% in Ireland, compared with a weighted EU average of 69%, the 2025 country profile reports. Occupancy and delayed discharge are different measures, so the gap does not prove that delayed transfers caused Ireland’s higher occupancy rate.
How we compiled these statistics
Irish Stairlifts compiled this reference from HSE administrative reports and official European Commission and OECD publications reviewed on 9 November 2026. The main current sources are the weekly HSE report for the week ending 1 November 2026, the July management report and a 2026 HSE response covering completed-year hospital data for 2024 and 2025.
Bed days lost, weekly averages, annual averages and end-of-year snapshots are presented separately. HSE management figures are preliminary and may change after validation. Regional values are shown as raw totals because the source does not convert them into rates adjusted for population, hospital capacity or patient need.
The year in this article’s title is the roundup and review year. It does not mean that every statistic was measured in 2026. The historical comparison measures 2016, the newest EU context measures 2023, the completed-year figures cover 2025, and the latest operational report covers the week ending 1 November 2026.
Irish Stairlifts is the compiler of this roundup, not the original authority behind the figures. The HSE, European Commission and OECD remain the named sources for their respective data.
How Irish Stairlifts can help with returning home
A delayed hospital discharge can involve many clinical, residential, legal, housing and support issues. A stairlift does not replace medical clearance, rehabilitation, personal care, a home-support package or a discharge plan.
Where an individual has been assessed as ready to return home but cannot safely use the stairs, a professionally assessed stairlift may be one part of preparing the property. Irish Stairlifts can explain straight and curved options, assess the staircase and discuss timing through its emergency stairlift installation service. Short-term straight-stair solutions may also be available through stairlift rental options.
Suitability depends on the person’s ability to transfer safely, the staircase and the wider plan agreed with the relevant professionals and family.
Related Irish statistics
Delayed transfers are connected with the availability of support at home, residential care and suitable housing, but each dataset measures a different part of the system.
- Our HSE home-support statistics cover funded hours, recipients, waiting lists and regional activity.
- The Irish nursing-home statistics explain registered capacity, Fair Deal activity and projected residential-care requirements.
- The home accessibility statistics examine housing features and reported accessibility needs.
- The housing-grant statistics cover funding and activity under Ireland’s home-adaptation schemes.
Related Post
categories
- Accessible Bathrooms 22
- Grants & Funding 8
- ISB Mobility 6
- Mobility Aids 42
- Outdoor & Independence Solutions 44
- Seating Solutions 10
- Stairlifts & Home Lifts 38
- Statistics 13