
Older People’s Housing Statistics Ireland 2026: 83.4% of 65+ Households Were Owner-Occupied

Sources reviewed 6 October 2026 · Estimated reading time: 12 minutes | Human written and fact checked against each named source.
In Census 2022, 83.4% of permanent private households whose reference person was aged 65 or over were owner-occupied. This 2026 roundup brings that housing-tenure baseline together with newer figures on social housing support, rent burden, population change and Ireland’s position within the EU. The dates differ because each official series is released on its own schedule: the core tenure figures are from Census 2022, social-housing figures end in 2024, the EU comparison covers 2025, and the newest population estimate is for April 2026.
Throughout this article, a “65+ household” means a household whose reference person was aged 65 or over. It is not a count of every older person in that household, and it should not be confused with the separate person-level population figures used later.
Older people’s housing statistics at a glance
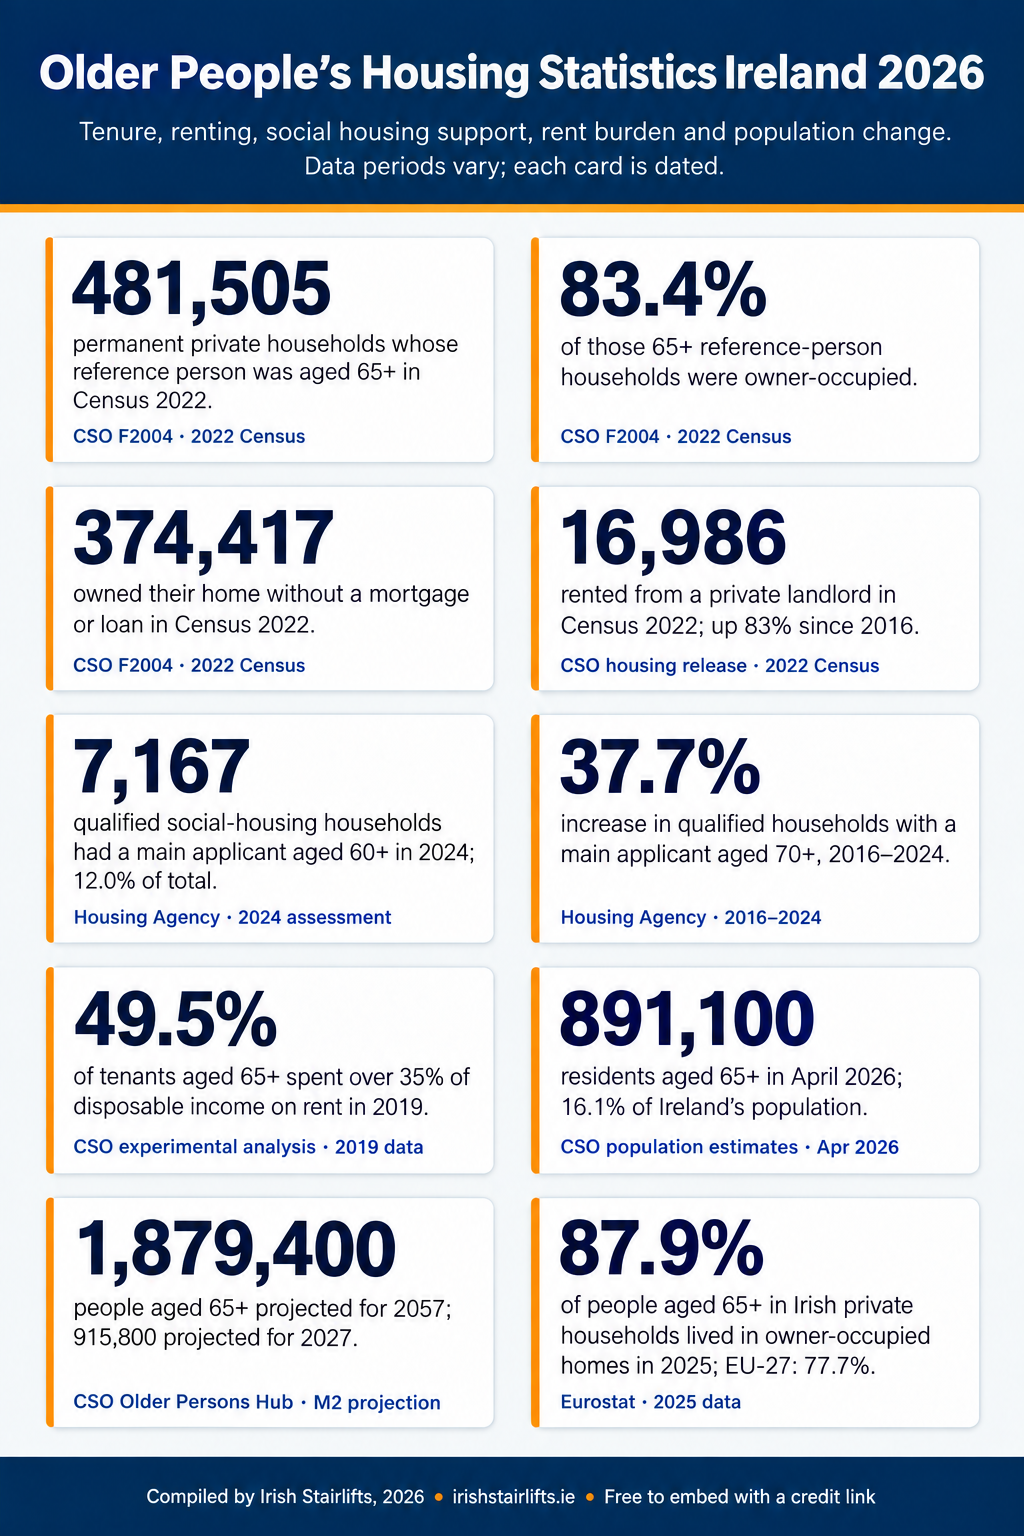
- Census 2022 recorded 481,505 permanent private households whose reference person was aged 65 or over, according to the CSO housing table.
- 401,596 of those households, or 83.4%, were owner-occupied, including homes with and without a mortgage or loan, based on the Census tenure data.
- 374,417 households headed by someone aged 65+ owned their home without a mortgage or loan in Census 2022, the CSO table shows.
- 16,986 households headed by someone aged 65+ rented from a private landlord in 2022, an increase of 83% since Census 2016, according to the CSO tenure release.
- The three explicit rental categories covered 53,899 households, or 11.2% of the 65+ household total in Census 2022, as calculated from the Census housing table.
- In the 2024 assessment, 15,787 qualified households had a main applicant aged 50 or over, equal to 26.3% of all assessed households in the Housing Agency dataset.
- 7,167 qualified households had a main applicant aged 60 or over in 2024, representing 12.0% of the assessment total in the same official dataset.
- The number of qualified households with a main applicant aged 70+ rose from 1,603 in 2016 to 2,208 in 2024, an increase of 37.7%, according to the Housing Agency series.
- Ireland had an estimated 891,100 residents aged 65 or over in April 2026, equal to 16.1% of the population, according to the CSO population estimates.
- In 2025, 87.9% of people aged 65+ in Irish private households lived in an owner-occupied home, compared with 77.7% across the EU-27, according to the matched Eurostat tenure dataset.
Older People’s Housing Statistics Infographic
The infographic below summarises ten of the headline figures. It may be reused with a credit link to this page.
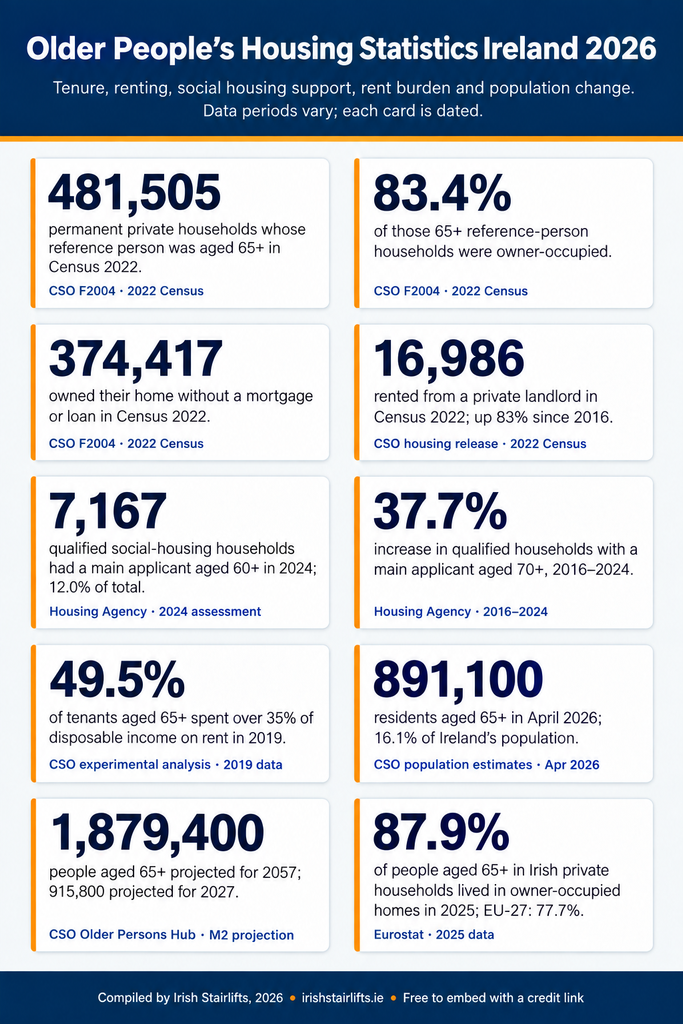
Older People’s Housing Statistics Ireland 2026, compiled by Irish Stairlifts. Free to embed. Please credit Irish Stairlifts with a link to this page: https://irishstairlifts.ie/older-people-housing-statistics-ireland/
How many older households are there in Ireland?
The most detailed national housing-tenure baseline comes from Census 2022. Adding the five published age bands from 65–69 through 85+ gives 481,505 permanent private households whose reference person was aged 65 or over in the CSO’s F2004 table. The largest of those bands was age 65–69, with 141,163 households, or 29.3% of the 65+ household total.
At the oldest end of the table, 54,205 households had a reference person aged 85 or over. That was 11.3% of all households in the combined 65+ bands. These figures describe households by the age of one designated reference person. They do not tell us how many people aged 65+ lived in the household, whether the household contained a couple, or whether the home was suitable for a resident’s mobility needs.
This distinction matters when using the data. A two-person household can appear once in the Census housing table, while each person may be counted separately in population or survey data. The tenure figures below therefore stay in household units and are not combined with person-level percentages.
Home ownership was the dominant tenure among 65+ households
Census 2022 recorded 401,596 owner-occupied households whose reference person was aged 65 or over. This represented 83.4% of the full 65+ household total, including households for which tenure was not stated. The calculation combines the two ownership categories in the Census tenure table.
Most of these households owned their home outright. There were 374,417 households in the “owner occupied without loan or mortgage” category, while 27,179 households were owner-occupied with a mortgage or loan.
The number of homes owned outright by a household whose reference person was aged 65+ increased from 319,651 in Census 2016 to 374,417 in Census 2022. The CSO described this as a 17% increase in its home ownership analysis. This is growth in the number of households, not a 17 percentage-point increase in the ownership rate.
High ownership does not by itself show that a home is accessible, affordable to maintain or suitable for ageing at home. Tenure describes the legal and financial basis on which a home is occupied. It does not measure stairs, bathroom layout, condition, location, support needs or the cost of adapting the property.
Renting among households headed by someone aged 65+
The three explicit rental categories in Census 2022 covered 53,899 households whose reference person was aged 65 or over. That was 11.2% of the 481,505-household total in the CSO housing table. A further 8,827 households occupied their home rent-free, while tenure was not stated for 17,183 households.
Local-authority renting was the largest of the three rental categories, covering 31,124 households. Another 16,986 households rented from a private landlord, and 5,789 households rented from a voluntary body. These categories should remain separate because they describe different housing arrangements and cannot be used as substitutes for one another.
The private-rental count changed notably between the two most recent censuses. The number of households headed by someone aged 65+ and renting from a private landlord was 83% higher in Census 2022 than in Census 2016, according to the CSO’s published comparison. The 2022 total was 16,986 households. This does not mean that all private renters aged 65+ increased by 83%, because the Census measure classifies the household by its reference person.
The 83% rise also needs context. It reports a change in the number of qualifying households between two census dates. It does not explain why the number changed, how long people had rented, what rents they paid or whether those homes met their needs.
Older applicants in the social housing assessment
The Housing Agency’s Social Housing Summary Assessment provides a different view. It counts households qualified for social housing support at the assessment date and groups them by the age of the main applicant. It is not a count of all people experiencing housing difficulty, annual applications, new entrants or allocations.
Across all ages, the 2024 assessment recorded 59,941 qualified households. Of these, 8,620 households had a main applicant aged 50–59, 4,959 had a main applicant aged 60–69, and 2,208 had a main applicant aged 70 or over. Together, the three 50+ groups accounted for 15,787 households, or 26.3% of the assessment total in the Housing Agency data.
Using only the two bands that begin at age 60, the assessment contained 7,167 qualified households with a main applicant aged 60 or over. That was 12.0% of the national total. The 60+ count increased from 6,594 households in 2016 to 7,167 in 2024, a rise of 573 households, or 8.7%.
The change was larger within the published 70+ band. Qualified households with a main applicant aged 70 or over increased from 1,603 in 2016 to 2,208 in 2024. That was an increase of 605 households, or 37.7%. The percentage describes the change in the administrative count, not the share of Ireland’s older population in housing need, and it does not reveal individual waiting times.
Dublin City accounted for 1,433 qualified households with a main applicant aged 60+ in 2024, equal to 20.0% of the national 60+ assessment total. This is a raw count rather than a population rate, so it should not be used to rank housing access or need across local authorities.
What the available data says about rent burden
The newest suitable national figure we located for rent burden by older age group comes from the CSO’s experimental analysis of the rental sector, published in 2021 and measuring 2019. In that linked-data study, tenants aged 65+ spent a median 34.9% of disposable income on rent, according to Figure 4.1 of the report.
The same analysis found that 49.5% of tenants aged 65+ spent more than 35% of disposable income on rent. The median does not mean every older tenant paid 34.9%, and the 49.5% result should not be presented as a current 2026 rate.
The CSO labelled the work a Frontier Series experimental analysis. It linked administrative sources for 118,730 tenants overall, did not capture every tenant, and estimated an individual’s rent by dividing the registered tenancy rent by the number of reported occupants. The results are useful historical evidence, but their date and method need to remain visible whenever they are cited.
An ageing population will change the housing context
Ireland had an estimated 891,100 residents aged 65 or over in April 2026. They represented 16.1% of the usually resident population, according to the CSO’s latest estimates. The estimated 65+ population increased by 30,000 people, or 3.5%, between April 2025 and April 2026.
Compared with April 2020, the 65+ population was an estimated 165,000 people larger in April 2026. Using the rounded endpoints of 726,100 and 891,100, that is a 22.7% increase. The CSO notes that its population estimates from 2023 to 2026 are preliminary and may be revised after Census 2027.
The longer-term figures are projections rather than observed outcomes. The CSO Older Persons Hub projects 915,800 people aged 65+ in 2027 and 1,879,400 in 2057. The projected old-age dependency ratio, defined as the population aged 65+ as a percentage of the population aged 15–64, rises from 25.0% in 2027 to 49.8% in 2057 in the CSO projection release.
These projections show the scale of demographic change that housing policy and services may need to consider. They do not predict how many people will own, rent, move, adapt a home or need a stairlift, and they should not be converted directly into a product-demand estimate.
How Ireland compares with the EU
Eurostat provides a matched 2025 comparison for people aged 65+ living in private households. It estimates that 87.9% of Ireland’s 65+ private-household population lived in an owner-occupied home, compared with 77.7% across the EU-27. Within the same Eurostat dataset, 84.4% in Ireland lived in an owner-occupied home with no outstanding mortgage or housing loan, versus 70.1% across the EU-27.
Tenants represented 12.1% of people aged 65+ in Irish private households in 2025, compared with 22.3% across the EU-27. The market-price tenant share was 2.6% in Ireland and 13.0% in the EU-27. People in reduced-price or rent-free tenure made up 9.5% in Ireland and 9.3% across the EU-27.
These EU figures use the same year, age group, sex category, unit and tenure definitions for Ireland and the EU-27. However, they are person-level EU-SILC estimates for people in private households and exclude institutional or collective households. They are therefore useful for comparing Ireland with the EU, but they should not be compared directly with the 83.4% Census figure, which counts households by the age of the reference person. A lower tenant share also does not prove that housing is more secure, affordable or suitable.
How we compiled these statistics
This article was compiled from primary data published by the Central Statistics Office, the Housing Agency Research Unit and Eurostat. Sources were checked on 6 October 2026. We used Census 2022 table F2004 for household tenure, the 2016–2024 Social Housing Summary Assessment series for qualified households by main-applicant age, the CSO’s April 2026 population estimates, the April 2026 Older Persons Information Hub projections, the CSO’s experimental 2019 rent-burden analysis, and Eurostat’s 2025 tenure comparison.
Calculated totals and shares were produced only where the relevant source cells used compatible definitions. Percentages are rounded to one decimal place. The Census section counts permanent private households according to the age of the household reference person. The social-housing section counts qualified households according to the age of the main applicant. The population and Eurostat sections count people. These denominators are not interchangeable.
The 2026 date in the title identifies the year this roundup was prepared, not the year of every statistic. Population estimates from 2023 to 2026 are preliminary. The 2027–2057 population values are projections, not guaranteed outcomes. The rent-burden figures are experimental 2019 linked-data estimates with incomplete tenant coverage. Readers using a figure in research or reporting should follow its inline link and retain its year, age threshold, unit and methodological qualification.
How Irish Stairlifts Can Help and Further Irish Statistics
Housing tenure is only one part of ageing at home. A person may own, rent or live rent-free in a home that works well for them, or they may encounter barriers that tenure data cannot show. Where stairs limit the use of a home, Irish Stairlifts can assess the property and explain suitable stairlift options. Any recommendation should be based on the individual and the home, not on age or tenure alone.
For related evidence, see our statistics on home accessibility needs, housing adaptation grants and older people living alone. Those pages cover distinct topics and should be read alongside, rather than merged with, the housing-tenure measures in this article.
Related Post
categories
- Accessible Bathrooms 20
- Grants & Funding 8
- ISB Mobility 6
- Mobility Aids 42
- Outdoor & Independence Solutions 44
- Seating Solutions 10
- Stairlifts & Home Lifts 36
- Statistics 9