Assistive Technology Statistics Ireland 2026: 7,900 Education Applications Recorded in 2023

Sources reviewed 14 October 2026 · Estimated reading time: 11 minutes. Human written and fact checked against each named source.
Assistive technology can support mobility, communication, vision, hearing, learning and everyday independence. In Ireland, however, the available statistics are spread across education applications, disability-service records, Census data, individual programmes and an older national survey of unmet need.
This 2026 roundup brings those sources together without treating them as one national total. The newest system assessment was published in 2026, while the main administrative figures measure 2023 or 2024 and the only national product-level unmet-demand estimates come from 2006. The year in the title is therefore the edition year, not the observation year for every statistic.
Key assistive technology statistics at a glance
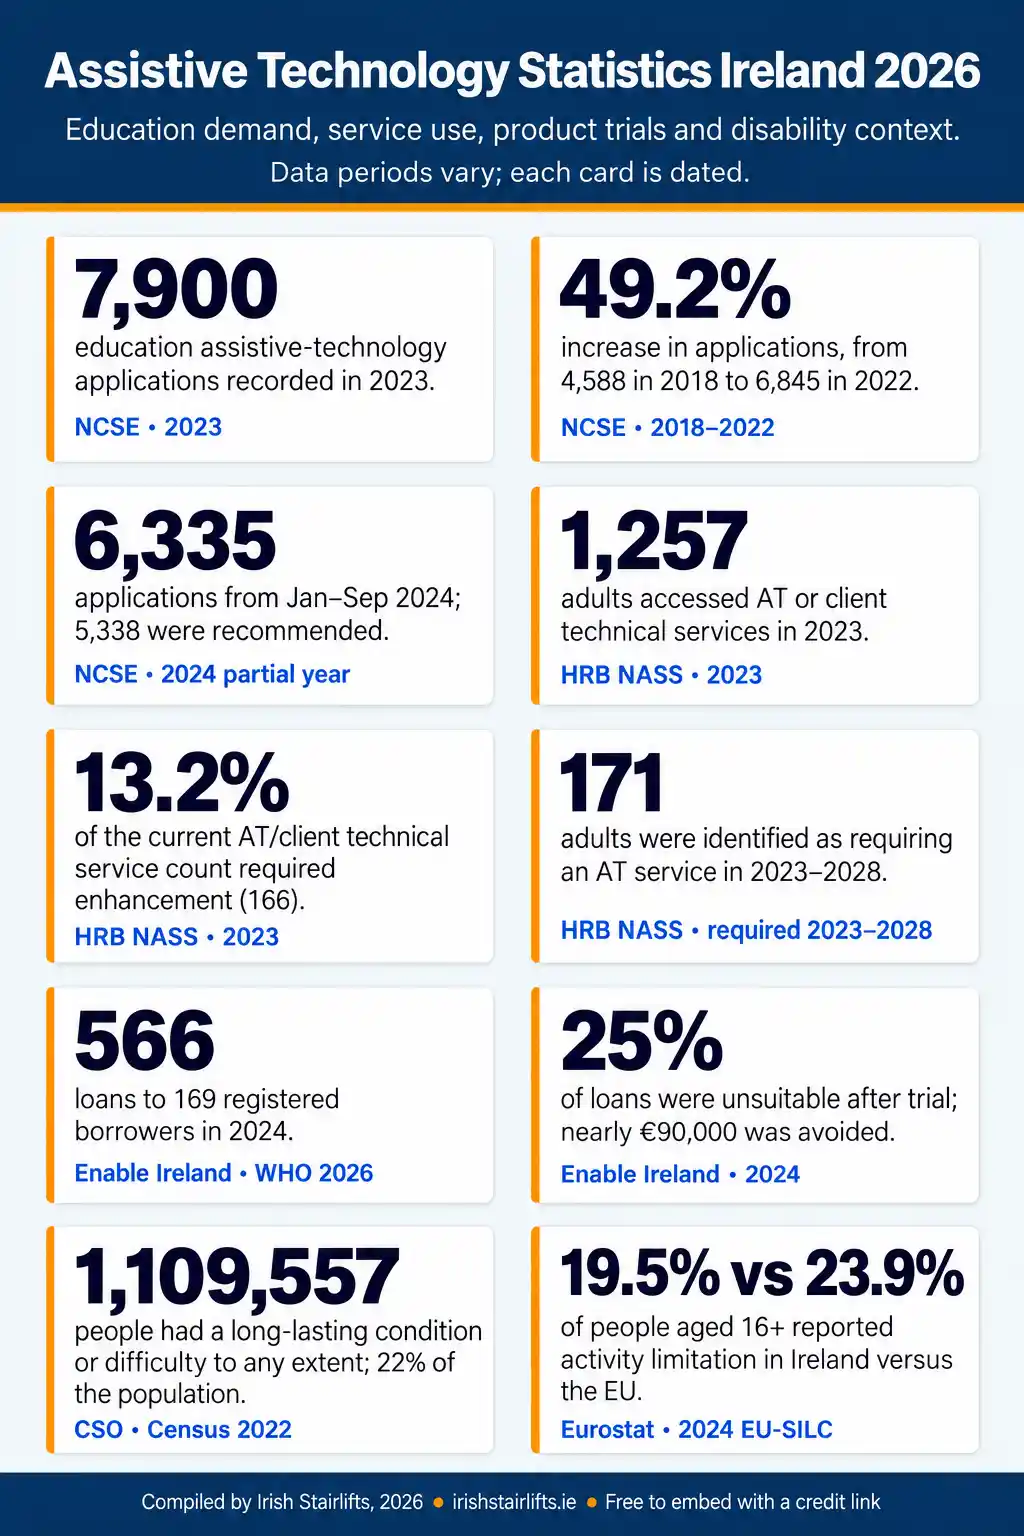
- The National Council for Special Education recorded 7,900 assistive-technology applications in 2023 under the Department of Education scheme, according to the NCSE applications file.
- Annual NCSE applications increased by 49.2%, from 4,588 in 2018 to 6,845 in 2022, calculated from the NCSE annual workbook.
- In the partial period from January to September 2024, the NCSE recorded 6,335 applications, of which 5,338 were recommended by SENOs, the same annual workbook shows.
- The Health Research Board recorded 1,257 adults accessing assistive-technology or client technical services in 2023 in its NASS service tables.
- Of those current AT or client technical services, 166 required enhancement, equivalent to 13.2% of the current-service count in the HRB table.
- Service providers identified 171 adults as requiring an AT or client technical service during 2023 to 2028, according to the NASS requirements table.
- Enable Ireland’s AT Loan Library recorded 566 loans for 169 registered borrowers in 2024, as reported in the WHO assessment.
- The library found that 25% of loans were unsuitable for purchase after trial, avoiding nearly €90,000 in unnecessary expenditure, the same WHO case study states.
- Census 2022 recorded 1,109,557 people, or 22% of Ireland’s population, with at least one long-lasting condition or difficulty to any extent, the CSO reported.
- In comparable 2024 EU-SILC data, 19.5% of people aged 16 or over in Ireland reported some or severe long-standing activity limitation, compared with 23.9% across the EU, according to Eurostat’s disability data.
Assistive Technology Statistics Ireland 2026 Infographic
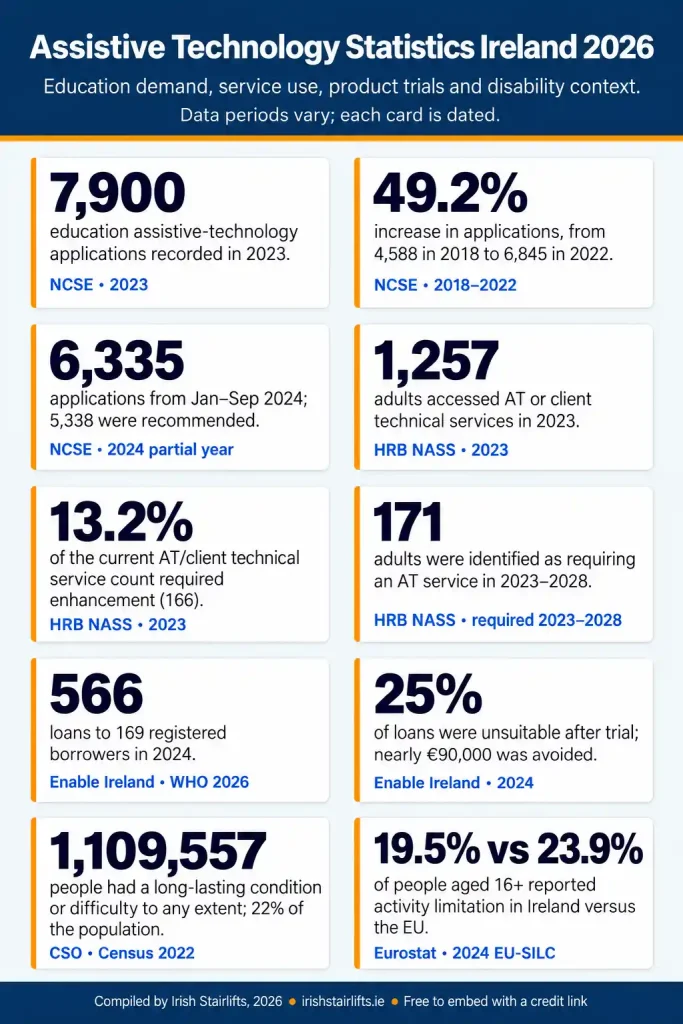
Assistive Technology Statistics Ireland 2026, compiled by Irish Stairlifts. Free to embed. Please credit Irish Stairlifts with a link to this page: https://irishstairlifts.ie/assistive-technology-statistics-ireland/
Education applications for assistive technology
The most detailed recent application data comes from the National Council for Special Education. The NCSE recorded 7,900 assistive-technology applications during 2023 as part of the Department of Education scheme. This is an administrative measure of applications received and processed, not a count of unique pupils, approvals, devices purchased or equipment delivered.
The quarterly pattern was uneven. The 2023 NCSE file records 2,117 applications in the first quarter, 2,083 in the second, 1,319 in the third and 2,381 in the fourth. Q4 had the largest published quarterly total. This comparison is descriptive and has not been adjusted for school calendars or processing schedules.
The related gender file records 2,625 applications as female, 5,230 as male and 45 without a recorded gender. These were 33.2%, 66.2% and 0.6% of the published annual total respectively, calculated from the NCSE gender data. The difference describes applications within this scheme and should not be interpreted as a population prevalence gap or evidence of its cause.
There is also a source discrepancy that readers should know about. The dedicated 2023 NCSE files total 7,900 applications, while the NCSE’s later multi-year workbook gives 7,675 for the same calendar year. No reconciliation note was located. For that reason, this roundup uses the dedicated annual files for the 2023 total, quarterly pattern and gender split. It does not combine the 7,900 denominator with recommendation figures from the multi-year workbook.
How applications changed from 2018 to 2022
The internally consistent portion of the multi-year NCSE series shows 4,588 applications in 2018, 5,271 in 2019, 4,741 in 2020, 6,373 in 2021 and 6,845 in 2022. From 2018 to 2022, the total increased by 49.2%.
Applications recommended by a Special Educational Needs Organiser numbered 3,350 in 2018, 3,719 in 2019, 3,500 in 2020, 4,607 in 2021 and 4,905 in 2022. That represents a 46.4% increase between 2018 and 2022, based on the published NCSE series.
The annual recommendation rate remained within a relatively narrow range over those five years. It was 73.0% in 2018, 70.6% in 2019, 73.8% in 2020, 72.3% in 2021 and 71.7% in 2022. Each percentage was calculated by dividing recommended applications by all applications in the same year.
These rates should not be used as a stand-alone performance score. Changes may reflect the mix of applications, eligibility rules, supporting evidence, processing timing or other administrative factors. A recommendation also does not confirm that equipment was purchased, supplied or used successfully.
The latest period in the workbook is labelled “2024 Jan–Sept”, even though the dataset title refers to October 2024. The more precise workbook label is used here. During those nine months, 6,335 applications were recorded and 5,338 were recommended, producing a published recommendation rate of 84.3%. Because this is a partial year, it should not be compared with full calendar years as if the periods were identical.
Assistive technology services recorded by the HRB
The Health Research Board’s National Ability Supports System provides a different view. NASS covers people registered with disability services, rather than education applications or the population as a whole.
In 2023, HRB Table 3.6 recorded 1,257 adults accessing an assistive-technology or client technical service. It also recorded 166 current services as requiring enhancement. Dividing 166 by 1,257 gives an enhancement rate of 13.2%, but “enhancement required” does not mean the person had no service.
The same table recorded 164 adults accessing vision communication IT, AT and alternative-format services. Of these, 42 services required enhancement, equivalent to 25.6% of the current-service count. Aural communication IT, AT and alternative-format services were recorded for 25 adults, with 11 requiring enhancement. That is 44.0%, but the small denominator means the count should always be shown with the percentage.
Among adults whose primary disability was physical or sensory, 1,063 accessed an AT or client technical service in 2023. This is a subset of the national NASS adult count of 1,257, not an additional group. The HRB bulletin also reported that 6,221 adults in the physical or sensory group, or 62%, received at least one support from a multidisciplinary team or specialised disability service.
NASS allows more than one service to be recorded for a person. Its service rows therefore cannot be added together to estimate unique users, and the figures should not be divided by Census disability totals to create a national access rate.
Services identified as required
Service providers recorded both current provision and requirements for future services. The 2023 requirements table identified 171 adults as requiring an assistive-technology or client technical service during the 2023 to 2028 period.
The table also identified 54 adults as requiring vision communication IT, AT or alternative-format services and nine as requiring aural communication IT, AT or alternative-format services. Across all specialist-support categories, 3,110 adults were recorded as requiring at least one support.
The 171, 54 and nine are provider-identified requirements among people registered on NASS. They are not national forecasts of everyone who may need assistive technology. A person may require more than one listed service, while values below five are suppressed in the source to protect confidentiality.
What trial services can show
Product trials can help users and professionals assess whether a device suits the person’s goals and environment before money is committed. The 2026 WHO assessment includes an operational example from Enable Ireland’s Assistive Technology Loan Library.
In 2024, the library recorded 566 loans for 169 registered borrowers across children’s and adult services. Loan activity was 53% higher than in the previous year, according to the WHO case study. The report does not print the underlying 2023 count, so this roundup does not attempt to reconstruct it from the rounded percentage.
One quarter of loans were considered unsuitable for purchase after trial. The library estimated that this avoided nearly €90,000 in unnecessary expenditure. These figures demonstrate the possible value of trial-before-purchase within one provider’s services. They are not a national abandonment rate, a measure of all AT loans in Ireland or a guarantee that every loan service would produce the same savings.
Historical evidence on unmet need
Ireland does not yet have a current population-wide measure showing how many people need assistive products, how many receive suitable products and how many have unmet need. The detailed product-level table reproduced in the 2026 WHO assessment comes from the 2006 National Disability Survey.
In that historical survey, unmet demand for lifts or stairlifts was estimated at 64.6%, representing about 19,100 people who needed the product. The WHO unmet-demand table also reported 47.4% unmet demand for portable ramps, affecting about 13,900 people, and 33.2% for grab bars or bathroom aids, affecting about 32,100 people.
Other historical estimates included 22.1% unmet demand for a manual or electric wheelchair or scooter, affecting about 8,900 people, and 11.4% for walking aids, affecting about 10,700 people. These figures remain useful for showing the kinds of gaps Ireland has attempted to measure, but they are not current estimates and should never be presented as 2026 conditions.
The age of this evidence is itself an important finding. The WHO assessment identifies gaps in coordination, data, funding and continuity, and sets out 45 recommended actions. A current national baseline would make it easier to track whether need, access and outcomes are changing.
Wider population context
Census figures help describe the population that may benefit from accessible environments or assistive products, but they do not measure product need directly. In Census 2022, 1,109,557 people reported at least one long-lasting condition or difficulty to any extent. This represented 22% of the population. Of these, 407,342 people, or 8% of the population, reported a condition or difficulty to a great extent or a lot, according to the CSO key findings.
The CSO disability profile recorded 349,155 people with difficulty carrying out basic physical activities such as walking, climbing stairs, reaching, lifting or carrying. That was just under 7% of the population. This combined category cannot be interpreted as the number of people who need a stairlift.
The same census recorded 296,601 people, or 6% of the population, experiencing blindness or a vision impairment to any extent. A further 233,420 people, or 5%, reported deafness or a hearing impairment to any extent. People could report more than one long-lasting condition or difficulty, so these categories overlap and should not be added together.
Readers looking specifically at movement-related Census data can use our mobility disability statistics roundup, which explains the revised 2022 measure and its age and sex breakdowns in more detail.
Public investment and current system development
Government announced more than €1 million for nine CREATE III digital and assistive-technology projects in December 2025. The projects cover mobility, communication, hearing, vision and accessibility, including an early AT clinic for infants and young children and an expanded national library for people who are deafblind.
The CREATE III announcement also states that the previous CREATE II phase benefited more than 1,200 individuals and staff through new AT pathways, libraries and training. This is a mixed beneficiary measure, not a count of unique assistive-technology users.
There is a small publication discrepancy in the award announcement. The government headline states “over €1 million”, while the nine itemised awards visible on the page sum to €975,000. This roundup retains the department’s stated total and does not substitute the calculated item total without clarification of what the headline includes.
Ireland compared with the EU
Eurostat provides a compatible comparison for long-standing activity limitation, although it does not measure access to assistive technology. In 2024, 19.5% of people aged 16 or over in Ireland reported some or severe limitation in their usual activities due to a health problem. This comprised 14.6% reporting some limitation and 4.9% reporting severe limitation.
Across the EU-27, the corresponding total was 23.9%, comprising 17.2% with some limitation and 6.7% with severe limitation. The figures come from the same Eurostat measure, reference year and age threshold.
The comparison still requires care. EU-SILC covers people living in private households, so people in institutions and collective households are generally excluded. The figures are self-reported and are not age-standardised. Ireland’s lower percentage in this dataset does not prove better AT access, better accessibility or a healthier population after differences in age structure, reporting and survey implementation are considered.
How we compiled these statistics
Irish Stairlifts reviewed the primary sources on 20 October 2026. Education application data came from the NCSE’s dedicated 2023 files and its separate multi-year workbook. Disability-service figures came from the Health Research Board’s NASS 2023 bulletin, physical and sensory supplement and detailed service tables. Population context came from Census 2022, while the international comparison used Eurostat’s 2024 EU-SILC activity-limitation measure.
The World Health Organization’s 2026 Irish capacity assessment supplied the Enable Ireland case study, system context and the historical unmet-demand table. The Department of Children, Disability and Equality supplied the CREATE III programme figures.
Observation year and publication year are kept separate throughout. Applications are not treated as unique pupils or supplied devices. NASS service records are not treated as population prevalence. Census disability categories are not treated as product need. The 2006 unmet-demand estimates are labelled as historical, and the Eurostat comparison is described as activity-limitation context rather than an AT-access rate.
Calculated percentages use compatible figures from the same source. They are rounded to one decimal place. No figures from different administrative systems were added together, and no national AT access rate was created from incompatible denominators.
How Irish Stairlifts can help
National statistics cannot determine whether a particular product suits one person or one home. Appropriate equipment depends on the person’s needs, the property, professional advice where relevant and the available funding route.
Irish Stairlifts supplies stairlifts, ramps, wheelchairs, powerchairs, scooters and other mobility aids in Ireland. The team can discuss practical options and arrange a home assessment where appropriate. A recommendation should be based on the individual and the environment, not on a Census category or a national statistic alone.
For readers considering changes to stairs specifically, the stairlift service page explains the available straight, curved and reconditioned options. Grant decisions remain with the relevant local authority, and work should not begin until any required written approval has been received.
Related Post
categories
- Accessible Bathrooms 20
- Grants & Funding 8
- ISB Mobility 6
- Mobility Aids 42
- Outdoor & Independence Solutions 44
- Seating Solutions 10
- Stairlifts & Home Lifts 37
- Statistics 10